Αρχείο:U.S. Home Ownership and Subprime Origination Share.png

Εικόνα σε υψηλότερη ανάλυση (960 × 720 εικονοστοιχεία, μέγεθος αρχείου: 29 KB, τύπος MIME: image/png)
|
|
Αυτό το αρχείο και η περιγραφή του προέρχονται από το Wikimedia Commons. Οι πληροφορίες από την σελίδα περιγραφής του εκεί εμφανίζονται παρακάτω. |
Σύνοψη

|
This graph image could be re-created using vector graphics as an SVG file. This has several advantages; see Commons:Media for cleanup for more information. If an SVG form of this image is available, please upload it and afterwards replace this template with
{{vector version available|new image name}}.
It is recommended to name the SVG file “U.S. Home Ownership and Subprime Origination Share.svg”—then the template Vector version available (or Vva) does not need the new image name parameter. |
| Περιγραφή |
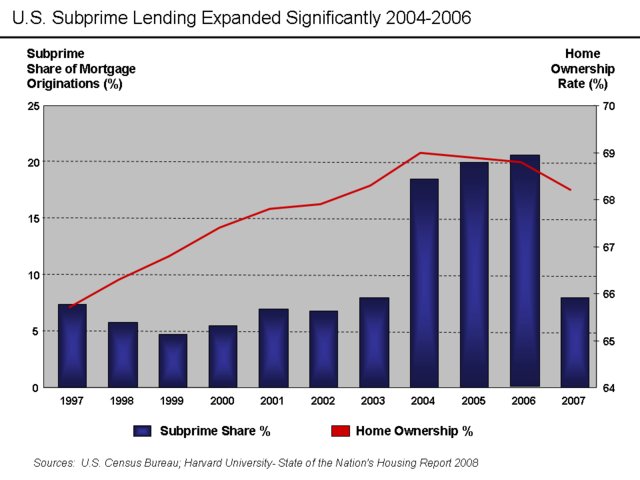
English: There are various mortgage categories defined based on the credit quality of the borrower. These include subprime, Alt-A, and Prime. The share of subprime mortgages is shown in the diagram. It is the ratio of the dollar value of subprime mortgages to all originations, expressed as a percentage. The level of home ownership is based on the percentage of American households that own homes rather than rent.
Subprime mortgages remained below 10% of all mortgage originations until 2004, when they spiked to nearly 20% and remained there through the 2005-2006 peak of the housing bubble.[1] A proximate event to this increase was the April 2004 decision by the SEC to relax the net capital rule, which encouraged the largest five investment banks to dramatically increase their financial leverage and aggressively expand their issuance of mortgage-backed securities. This applied additional competitive pressure to Fannie Mae and Freddie Mac, which further expanded their riskier lending.[2] Excerpts from the Harvard Report:
Other interpretations:
Source Data |
| Ημερομηνία | 30 Μαΐου 2009 (original upload date) |
| Πηγή | Transferred from en.wikipedia to Commons. |
| Δημιουργός | Farcaster at Αγγλικά Βικιπαίδεια |
Αδειοδότηση
- Είστε ελεύθερος:
- να μοιραστείτε – να αντιγράψετε, διανέμετε και να μεταδώσετε το έργο
- να διασκευάσετε – να τροποποιήσετε το έργο
- Υπό τις ακόλουθες προϋποθέσεις:
- αναφορά προέλευσης – Θα πρέπει να κάνετε κατάλληλη αναφορά, να παρέχετε σύνδεσμο για την άδεια και να επισημάνετε εάν έγιναν αλλαγές. Μπορείτε να το κάνετε με οποιοδήποτε αιτιολογήσιμο λόγο, χωρίς όμως να εννοείται με οποιονδήποτε τρόπο ότι εγκρίνουν εσάς ή τη χρήση του έργου από εσάς.
- παρόμοια διανομή – Εάν αλλάξετε, τροποποιήσετε ή δημιουργήσετε πάνω στο έργο αυτό, μπορείτε να διανείμετε αυτό που θα προκύψει μόνο υπό τους όρους της ίδιας ή συμβατής άδειας με το πρωτότυπο.

|
Παραχωρείται η άδεια προς αντιγραφή, διανομή και/ή τροποποίηση αυτού του εγγράφου υπό τους όρους της Άδειας Ελεύθερης Τεκμηρίωσης GNU, Έκδοση 1.2 ή οποιασδήποτε νεότερης έκδοσης δημοσιευμένης από το Ίδρυμα Ελεύθερου Λογισμικού· χωρίς Απαράλαχτους Τομείς, χωρίς Κείμενα Εξωφύλλου, και χωρίς Κείμενα Οπισθοφύλλου. Αντίγραφο της άδειας περιλαμβάνεται στην σελίδα με τίτλο GNU Free Documentation License. |
Καταγραφές ανεβασμάτων πρωτότυπου αρχείου
- 2009-05-30 23:44 Farcaster 960×720× (30085 bytes)
- 2009-05-30 23:16 Farcaster 960×720× (28829 bytes) {{Information |Description = Subprime mortgage share as % originations and home ownership rate |Source = [http://www.jchs.harvard.edu/publications/markets/son2008/son2008.pdf Harvard 2008 State of Nation's Housing Report] |Date = M
Ιστορικό αρχείου
Κλικάρετε σε μια ημερομηνία/ώρα για να δείτε το αρχείο όπως εμφανιζόταν εκείνη τη στιγμή.
| Ώρα/Ημερομ. | Μικρογραφία | Διαστάσεις | Χρήστης | Σχόλια | |
|---|---|---|---|---|---|
| τελευταία | 00:57, 14 Οκτωβρίου 2010 | | 960 × 720 (29 KB) | Hideokun | {{Information |Description={{en|There are various mortgage categories defined based on the credit quality of the borrower. These include subprime, Alt-A, and Prime. The share of subprime mortgages is shown in the diagram. It is the ratio of the dollar va |
Συνδέσεις αρχείου
Τα παρακάτω λήμματα συνδέουν σε αυτό το αρχείο:
Καθολική χρήση αρχείου
Τα ακόλουθα άλλα wiki χρησιμοποιούν αυτό το αρχείο:
- Χρήση σε de.wikipedia.org
- Χρήση σε en.wikipedia.org
- Χρήση σε fr.wikipedia.org
- Χρήση σε gu.wikipedia.org
- Χρήση σε hi.wikipedia.org
- Χρήση σε hy.wikipedia.org
- Χρήση σε it.wikipedia.org
- Χρήση σε ja.wikipedia.org
- Χρήση σε kn.wikipedia.org
- Χρήση σε lt.wikipedia.org
- Χρήση σε ta.wikipedia.org