Αρχείο:Antarctic Temperature Trend 1981-2007.jpg
Δεν διατίθεται υψηλότερη ανάλυση.
Antarctic_Temperature_Trend_1981-2007.jpg (540 × 508 εικονοστοιχεία, μέγεθος αρχείου: 93 KB, τύπος MIME: image/jpeg)
|
|
Αυτό το αρχείο και η περιγραφή του προέρχονται από το Wikimedia Commons. Οι πληροφορίες από την σελίδα περιγραφής του εκεί εμφανίζονται παρακάτω. |
Σύνοψη
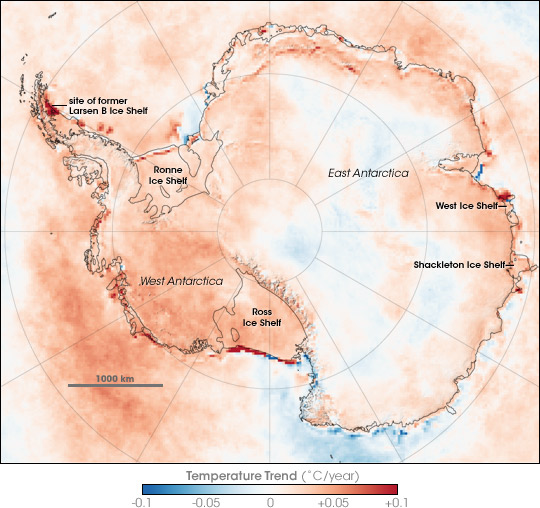
| Περιγραφή | Map showing Antarctic Skin Temperature Trends between 1981 and 2007. Skin temperature is roughly the top one millimeter of land, sea, snow, or ice. Across most of the Antarctic the temperature increased, in some areas warming approaching 2 degrees Celsius during the period. The map is based on thermal infrared (heat) observations made by a series of NOAA satellite sensors. None of the sensors were in orbit at the same time, so scientists could not compare simultaneous observations from different sensors to make sure each was recording temperatures exactly the same. Instead, the team checked the satellite records against ground-based weather station data to inter-calibrate them and make the 26-year satellite record. The level of uncertainty is between 2 and 3 degrees Celsius. The most dramatic changes are the red areas associated with iceberg calving and the collapse of the Larsen B ice shelf. In these cases, the satellites saw a change from cold ice to relatively warm open water. |
| Ημερομηνία | |
| Πηγή | en:Internet Archive - https://web.archive.org/web/20070823123915/http://earthobservatory.nasa.gov/Newsroom/NewImages/images.php3?img_id=17838 (originally http://earthobservatory.nasa.gov/Newsroom/NewImages/images.php3?img_id=17838 NASA Earth Observatory) |
| Δημιουργός | Robert Simmon |
| άλλες εκδόσεις | العربيَّة |
Αδειοδότηση
| Αυτό το αρχείο είναι κοινό κτήμα γιατί δημιουργήθηκε από την NASA. Η πολιτική πνευματικής ιδιοκτησίας της NASA δηλώνει ότι «Το υλικό της NASA δεν προστατεύεται από copyright εκτός αν αναφέρεται». (Σελίδα με την πολιτική πνευματικής ιδιοκτησίας της NASA ή Πολιτική Χρήσης Εικόνων του JPL). | ||
 |
Προσοχή:
|
Ιστορικό αρχείου
Κλικάρετε σε μια ημερομηνία/ώρα για να δείτε το αρχείο όπως εμφανιζόταν εκείνη τη στιγμή.
| Ώρα/Ημερομ. | Μικρογραφία | Διαστάσεις | Χρήστης | Σχόλια | |
|---|---|---|---|---|---|
| τελευταία | 22:13, 21 Νοεμβρίου 2007 | | 540 × 508 (93 KB) | Sagredo | {{Information |Description=Map showing Antarctic Skin Surface Temperature Trends 1981-2007. Skin temperature is roughly the top one millimeter of land, sea, snow, or ice. Across most of the Antarctic the temperature increased, in some areas approachi |
Συνδέσεις αρχείου
Τα παρακάτω λήμματα συνδέουν σε αυτό το αρχείο:
Καθολική χρήση αρχείου
Τα ακόλουθα άλλα wiki χρησιμοποιούν αυτό το αρχείο:
- Χρήση σε ar.wikipedia.org
- Χρήση σε ast.wikipedia.org
- Χρήση σε ca.wikipedia.org
- Χρήση σε en.wikipedia.org
- Χρήση σε eo.wikipedia.org
- Χρήση σε es.wikipedia.org
- Χρήση σε gl.wikipedia.org
- Χρήση σε ja.wikipedia.org
- Χρήση σε mk.wikipedia.org
- Χρήση σε nl.wikipedia.org
- Χρήση σε nn.wikipedia.org
- Χρήση σε pa.wikipedia.org
- Χρήση σε pl.wikipedia.org
- Χρήση σε ur.wikipedia.org
- Χρήση σε vi.wikipedia.org
- Χρήση σε zh.wikipedia.org