Αρχείο:Fujita scale technical.svg

Το μέγεθος αυτής της PNG προεπισκόπησης αυτού του SVG το αρχείο: 428 × 560 εικονοστοιχεία. Άλλες αναλύσεις: 183 × 240 εικονοστοιχεία | 367 × 480 εικονοστοιχεία | 587 × 768 εικονοστοιχεία | 783 × 1.024 εικονοστοιχεία | 1.565 × 2.048 εικονοστοιχεία.
Εικόνα σε υψηλότερη ανάλυση (Αρχείο SVG, ονομαστικό μέγεθος 428 × 560 εικονοστοιχεία, μέγεθος αρχείου: 376 KB)
|
|
Αυτό το αρχείο και η περιγραφή του προέρχονται από το Wikimedia Commons. Οι πληροφορίες από την σελίδα περιγραφής του εκεί εμφανίζονται παρακάτω. |
Σύνοψη
| Περιγραφή |
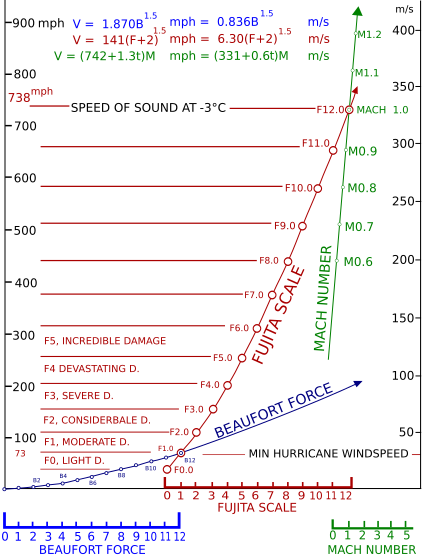
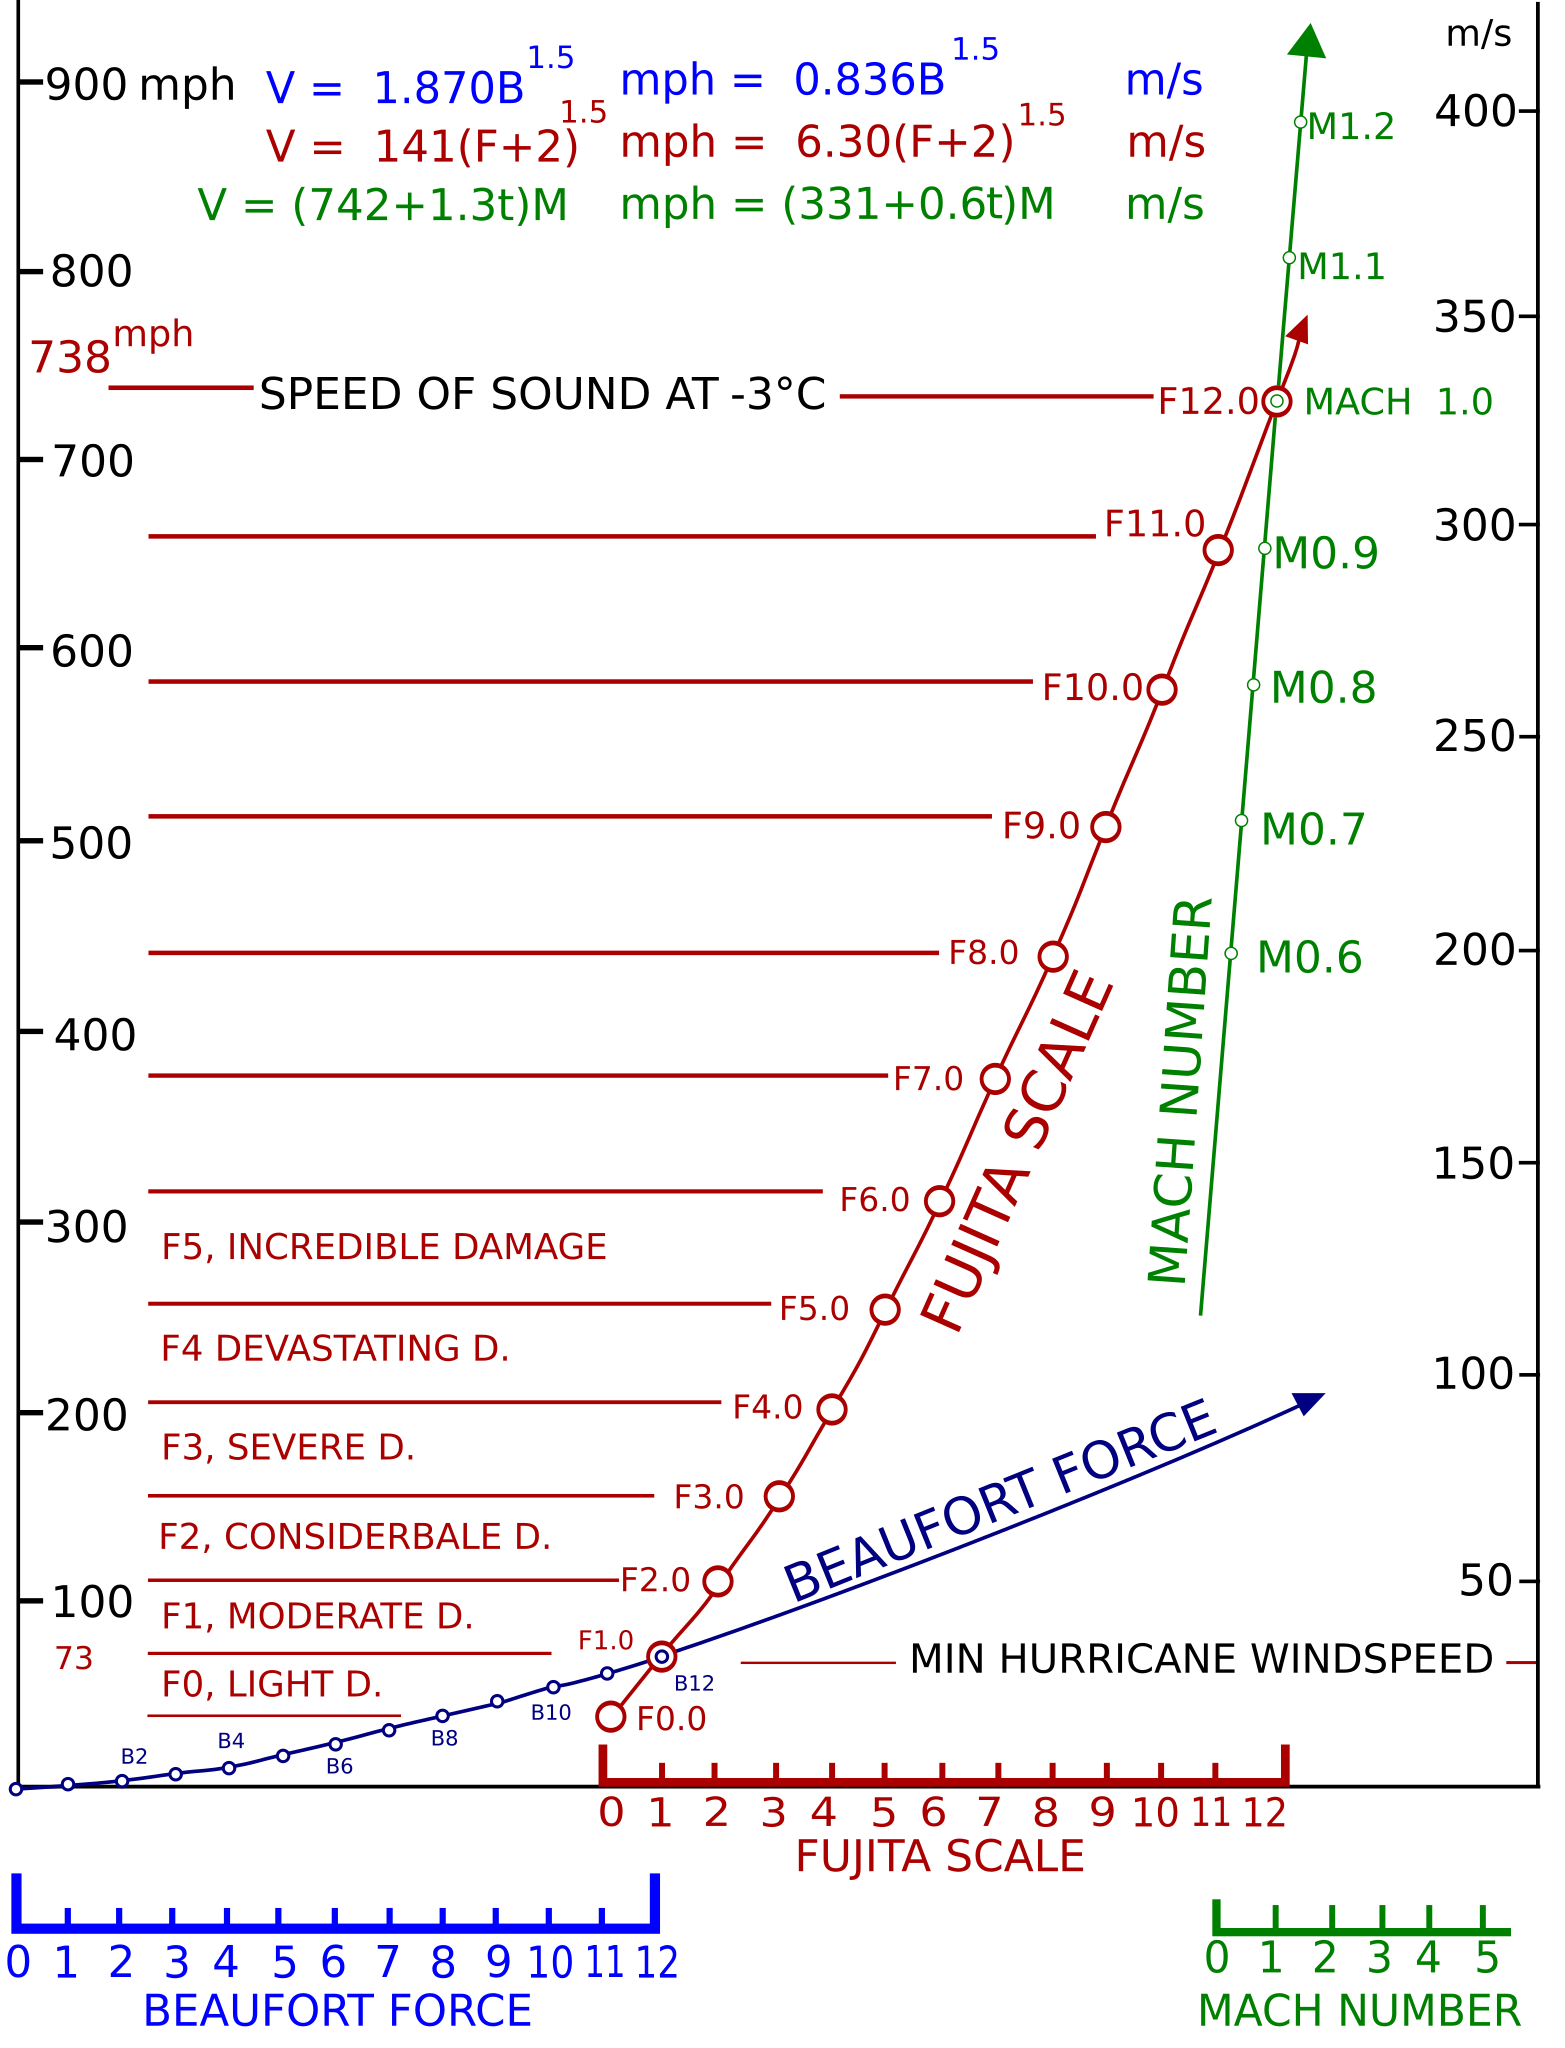
Français : Graphique de Dr. Ted Fujita (1920-1998) pour expliquer les détails technique de l'échelle qu'il a créé pour l'intensité des tornades. Elle fut publié dans un journal scientifique mais le docteur et sa famille l'ont ensuite rendue à l'usage public à condition de citer son origine
English: This is a schematic produced by Dr. Ted Fujita (1920-1998) when explaining the technical details of the Fujita tornado intensity scale when he introduced it. It was originally published in a science journal but he and his family have released all his available works for public use. Proper citation is still warranted, of course. |
| Ημερομηνία | |
| Πηγή | "Proposed characterization of tornadoes and hurricanes by area and intensity". Satellite Mesometeorology Research Program Research Paper Number 91, Department of Geophysical Sciences, University of Chicago. 42pp. (pdf version https://archive.org/download/nasa_techdoc_19720008829/19720008829.pdf) |
| Δημιουργός | Fujita, T.T. ,SVG Version - Rugby471 |
| άλλες εκδόσεις |
Derivative works of this file: Fujita scale technical-es.svg
|


If an f12 tornado were to hit anything that even got remotely close to it would be shredded into tiny bits
Αδειοδότηση

|
Ο κάτοχος των πνευματικών δικαιωμάτων αυτού του αρχείου επιτρέπει σε οποιονδήποτε να το χρησιμοποιήσει για οποιονδήποτε σκοπό, υπό τον όρο ότι ο κάτοχος των πνευματικών δικαιωμάτων θα αναφέρεται επαρκώς. Επιτρέπεται η αναδιανομή, τα παράγωγα έργα, η εμπορική χρήση, και κάθε άλλη χρήση. |
Απόδοση:
Dr. Ted Fujita published this diagram in Satellite Mesometeorology Research Program Research Paper Number 91, 1971, for public use. Description of license is at https://archive.org/details/nasa_techdoc_19720008829. The SGV version has been done by Rugby471
|
Ιστορικό αρχείου
Κλικάρετε σε μια ημερομηνία/ώρα για να δείτε το αρχείο όπως εμφανιζόταν εκείνη τη στιγμή.
| Ώρα/Ημερομ. | Μικρογραφία | Διαστάσεις | Χρήστης | Σχόλια | |
|---|---|---|---|---|---|
| τελευταία | 08:29, 2 Ιουνίου 2007 | | 428 × 560 (376 KB) | Rugby471 | Last EDIT |
| 08:15, 2 Ιουνίου 2007 |  | 428 × 560 (375 KB) | Rugby471 | 3rd EDIT | |
| 07:44, 2 Ιουνίου 2007 |  | 428 × 560 (376 KB) | Rugby471 | 2nd EDIT | |
| 18:11, 1 Ιουνίου 2007 |  | 428 × 560 (378 KB) | Rugby471 | Spare code making it not display properly | |
| 17:58, 1 Ιουνίου 2007 |  | 428 × 560 (379 KB) | Rugby471 | == Summary == This is a schematic produced by Dr. Ted Fujita (1920-1998) when explaining the technical details of the Fujita tornado intensity scale when he introduced it. It was originally published in a science journal but he and his family have release |
Συνδέσεις αρχείου
Τα παρακάτω λήμματα συνδέουν σε αυτό το αρχείο:
Καθολική χρήση αρχείου
Τα ακόλουθα άλλα wiki χρησιμοποιούν αυτό το αρχείο:
- Χρήση σε ar.wikipedia.org
- Χρήση σε cs.wikipedia.org
- Χρήση σε de.wikipedia.org
- Χρήση σε en.wikipedia.org
- Χρήση σε fi.wikipedia.org
- Χρήση σε fr.wikipedia.org
- Χρήση σε hi.wikipedia.org
- Χρήση σε ja.wikipedia.org
- Χρήση σε kn.wikipedia.org
- Χρήση σε ko.wikipedia.org
- Χρήση σε lv.wikipedia.org
- Χρήση σε pl.wikipedia.org
- Χρήση σε pl.wikiquote.org
- Χρήση σε pt.wikipedia.org
- Χρήση σε ru.wikinews.org
- Χρήση σε smn.wikipedia.org
- Χρήση σε vi.wikipedia.org