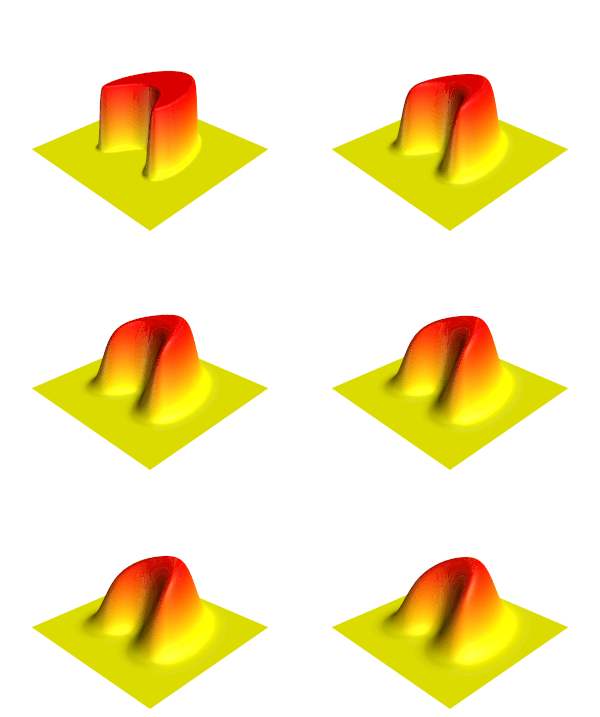
Heat_eqn.gif(200 × 136 εικονοστοιχεία, μέγεθος αρχείου: 500 KB, τύπος MIME: image/gif, κυκλικά επαναλαμβανόμενο, 181 καρέ, 6,0 s)

Σύνοψη

Περιγραφή
English: Illustration of the Heat equation.
Ημερομηνία (UTC)
Πηγή Έργο αυτού που το ανεβάζει
 
diagram δημιουργήθηκε με MATLAB.
Δημιουργός Oleg Alexandrov
άλλες εκδόσεις

Αδειοδότηση

Public domain Εγώ, ο κάτοχος των πνευματικών δικαιωμάτων αυτού του έργου, δημοσιεύω αυτό το έργο ως κοινό κτήμα. Αυτό ισχύει σε παγκόσμια κλίμακα.
Σε ορισμένες χώρες αυτό μπορεί να μην είναι νομικά εφικτό. Αν ναι:
Παραχωρώ σε οποιονδήποτε το δικαίωμα να χρησιμοποιήσει αυτό το έργο "για οποιονδήποτε σκοπό", χωρίς κανέναν όρο, εκτός και αν τέτοιοι όροι τίθενται από την νομοθεσία

MATLAB source code

% illustration of the heat equation
% Solve the heat equation using finite differences and Forward Euler
function main()
 
   % the number of data points. More points means prettier picture.
   N = 400;
 
   L = 2.5; % the box size is [-L, L] x [-L, L]
 
   XX = linspace(-L, L, N);
   YY = linspace(-L, L, N);
   [X, Y] = meshgrid(XX, YY);
 
   scale = 2;
   Z = get_step_function (N, scale, X, Y);
 
   CFL = 0.125; % CourantFriedrichsLewy
   dx = XX(2)-XX(1);  dy = dx; % space grid
   dt = CFL*dx^2;
 
   plot_dt = 0.004; % plot every plot_dt iterations

   cmap = rv_matrix_rows(autumn); % colormap
   
   % Solve the heat equation with zero boundary conditions
   T = 0:dt:1;
   iter = 0;
   frame_no = 0;
   for t=T
 
      % plot the current temperature distribution
      if floor(t/plot_dt) + 1 > frame_no
 
         frame_no = frame_no + 1
 
        % plot the surface
         figure(2); clf; 
         surf(X, Y, Z);
 
         %  make the surface beautiful
         shading interp; colormap(cmap); 
 
         % add in a source of light
         camlight (-50, 54);
         lighting phong;
 
         % viewing angle
         view(-40, 38);
 
         axis equal; axis off;
         axis([-L, L, -L, L, 0, scale])
 
         hold on; plot3(0, 0, 3.4, 'g*'); % a marker to help with cropping
 
         pause(0.1);
         %return
 
         file = sprintf('Movie_frame%d.png', 1000+frame_no);
         %saveas(gcf, file) %save the current frame
         print(gcf, '-dpng', '-r400', file) %save the current frame
 
         disp(file); %show the frame number we are at
 
         % cut at max_fr_no frames
         max_fr_no = 15; 
         if frame_no >= max_fr_no
            break
         end
 
      end
 
      % advance in time
      W = 0*Z;
      for i=2:(N-1)
         for j=2:(N-1)
 
            W(i, j) = Z(i, j) + dt * ( Z(i+1, j) + Z(i-1, j) + Z(i, j-1) + Z(i, j+1) - 4*Z(i, j))/dx^2;
 
         end
      end
      Z = W;
 
   end
 
 
% The gif image was creating with the command 
% convert -antialias -loop 10000  -delay 20 -compress LZW Movie_frame10* Heat_eqn.gif 
 
% get a function which is 1 on a set, and 0 outside of it
function Z = get_step_function(N, scale, X, Y)
 
   c = 2;
   d=-1;
   e=1;
   f=0.5;
   k=1.2;
   shift=10;
 
   Z = (c^2-(X/e-d).^2-(Y/f).^2).^2 + k*(c+d-X/e).^3-shift;
 
   Z = 1-max(sign(Z), 0);
   Z = scale*Z;

function X = rv_matrix_rows(X)

   [m, n] = size(XL);

   for i = 1:m
      j = m + 1 - i;
      if i < j
         tmp = X(i, :); X(i, :) = X(j, :); X(j, :) = tmp;
      end
   end

Λεζάντες

Δεν ορίστηκε λεζάντα

Items portrayed in this file

απεικονίζει

Ιστορικό αρχείου

Κλικάρετε σε μια ημερομηνία/ώρα για να δείτε το αρχείο όπως εμφανιζόταν εκείνη τη στιγμή.

Ώρα/Ημερομ.ΜικρογραφίαΔιαστάσειςΧρήστηςΣχόλια
τελευταία18:01, 2 Φεβρουαρίου 2024Μικρογραφία για την έκδοση της 18:01, 2 Φεβρουαρίου 2024200 × 136 (500 KB)Jahobrmore frames (by user Emil Dalalyan)
01:25, 12 Απριλίου 2019Μικρογραφία για την έκδοση της 01:25, 12 Απριλίου 2019200 × 136 (172 KB)Jorge StolfiDuplicated some framed at beginning so that readers can see the initial state. Added a couple blank frames at end to make it clear that the simulation ended. Slowed down the movie a bit.
19:58, 24 Απριλίου 2011Μικρογραφία για την έκδοση της 19:58, 24 Απριλίου 2011200 × 136 (116 KB)Oleg AlexandrovReverse the colormap (red is high).
06:11, 23 Νοεμβρίου 2007Μικρογραφία για την έκδοση της 06:11, 23 Νοεμβρίου 2007199 × 140 (126 KB)Oleg AlexandrovTweak, same license
05:51, 23 Νοεμβρίου 2007Μικρογραφία για την έκδοση της 05:51, 23 Νοεμβρίου 2007200 × 129 (112 KB)Oleg Alexandrov{{Information |Description=Illustration of the en:Heat equation |Source=self-made with Matlab |Date=~~~~~ |Author= Oleg Alexandrov |Permission=PD-self, see below |other_versions= }} {{PD-self}} ==MATLAB source code== <pre>

Τα παρακάτω λήμματα συνδέουν σε αυτό το αρχείο:

Καθολική χρήση αρχείου

Τα ακόλουθα άλλα wiki χρησιμοποιούν αυτό το αρχείο: